The first allocation algorithm can be divided in two phases: forecast and optimization. In this article, we will look at the first phase ("forecast") to understand how this module processes the information
Forecast
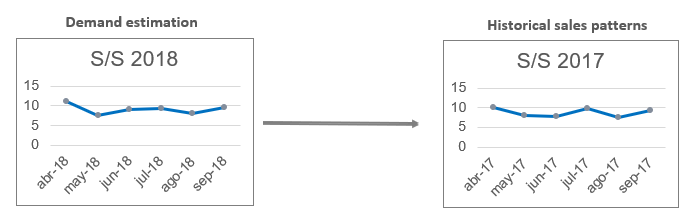
The aim of this phase is to generate a probabilistic forecast at the SKU and store level. In this step, the engine would collect existing data (past sales, stockouts, period on display) to predict future sales. However, we cannot forget that this is the first time the product has been sold in the stores, so there are no sales and stock history to analyze. However, even when there are no historical sales data for the exact products that are being allocated, Nextail still bases the process on demand estimates. How?
By using data from products acknowledged as "Comparables" items to those to be allocated.

How are the comparable products assigned?
- Automatically by Nextail and supervised by client experts.
- Comparable product suggestions based on visual similarity, attribute similarity, price, catalogue position and role in the overall collection.
How is the demand estimate calculated?
It is an automatic process that takes into account various comparable products, differences in seasonality patterns and store network, assortment effects, etc.
Demand forecasts based on comparable products are less accurate than those based on actual sales, so typically not all stock is sent in one go and adjustments are made later.
As the end of the planning horizon and the end of season are sufficiently apart, there will be a small or insignificant probability of the stock running out before both moments.
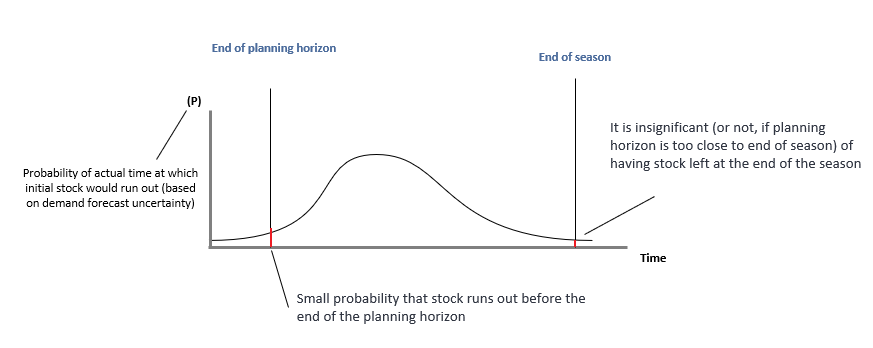
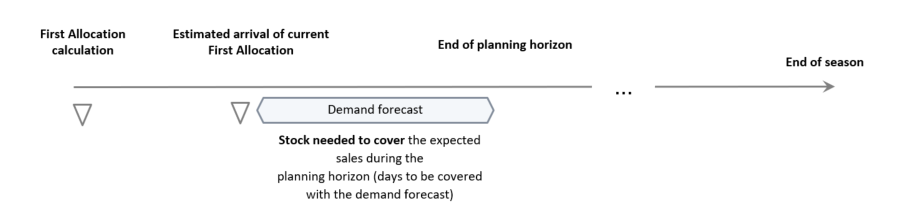
Even though the demand forecast in the first allocation is not highly precise, it still allows you to run a good stock allocation of the new products introduced (as long as the planning horizon is not very close to the end of the season).
The forecast will be calculated whether by the first X weeks of sales (of comparables) or by the 3 best weeks of sales (of comparables).The forecast will be calculated starting from the Allocation date, which can be set as today or as a future date.
Size curve calculation
Once the demand forecast is available for each product and store, it is split into “Product-size (SKU)” by applying expected size curves for that product-store combination.
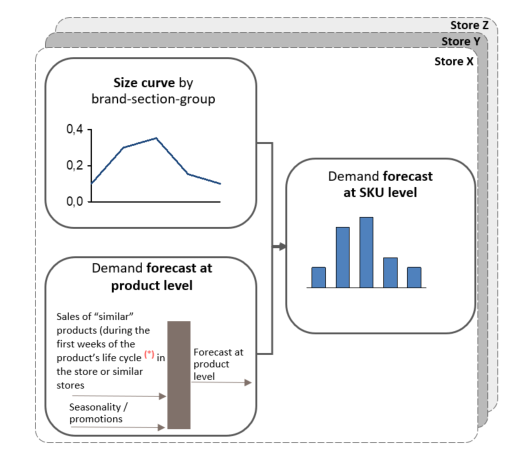
- Size curve between stores can vary up to 20%-25%: an accurate size curve calculation is mandatory to avoid significant over- or under- stocking of some sizes.
- We use information from comparable products to estimate applicable size curves to each product: Additional strategies are included to cover a potential lack of the right granular information.