There are two ways to get the forecast: Detailed Forecast and Fast Forecast
Detailed Forecast
The detailed forecast calculation in the by module takes into account comparable products with attributes that are closest to the expected product, as well as sales parameters by date.
The algorithm considers a specific period of time when the product is expected to be available in the store and has optimal conditions for selling.
To predict the new model future demand (quantities) in the potential phase the algorithms are divided in 4 phases:
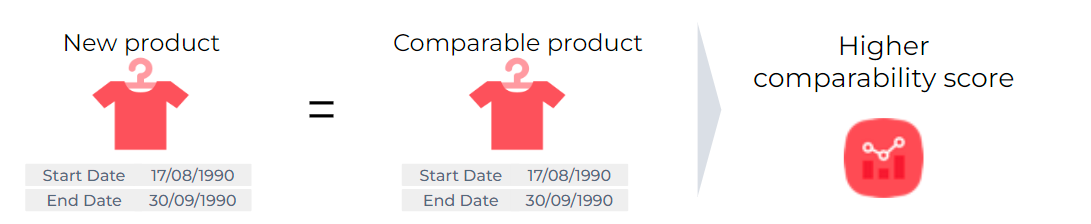
1. Comparable selection: In this phase the tool shows all the options of comparable products. The users should select the comparable products (as many as they want) to forecast the future demand based on the historical demand of the comparable selected.
Selling perimeter for the comparable products: period of time when the new product will be sold, so the algorithm takes it into account as a similarity attribute.
2. Demand Forecast: For all calculations, the period of time considered is when the product had optimal conditions to be selling as its full potential.
We understand this concept as weeks where the comparable product:
Has 60% of their size curve weight available in storeHas stock in store
Has sales
It is not on promotion/markdown

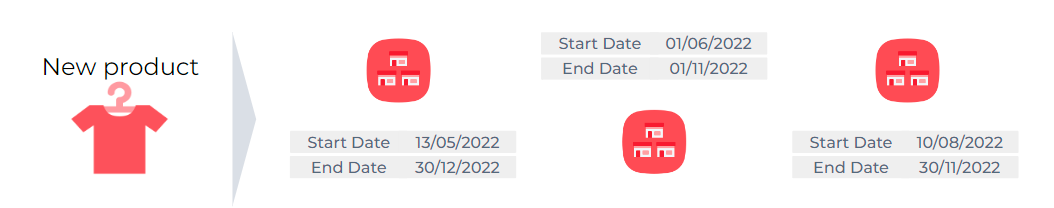
Selling perimeter or the demand forecast: You can then select a different time period in which the new product will be available in the different clusters.
3. Optimization
4. Review and execute the different scenarios
Fast Forecast:
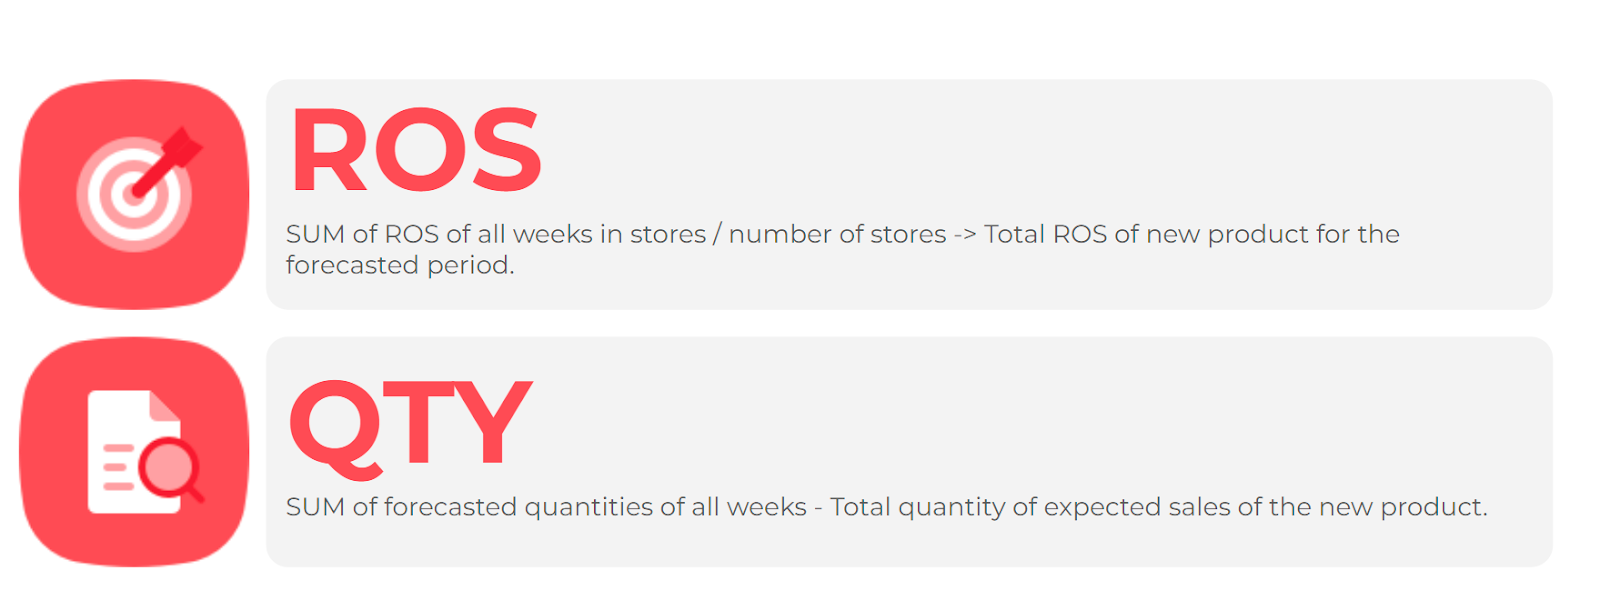
This time, instead of using specific similar products, we will calculate the forecast based on the ROS.
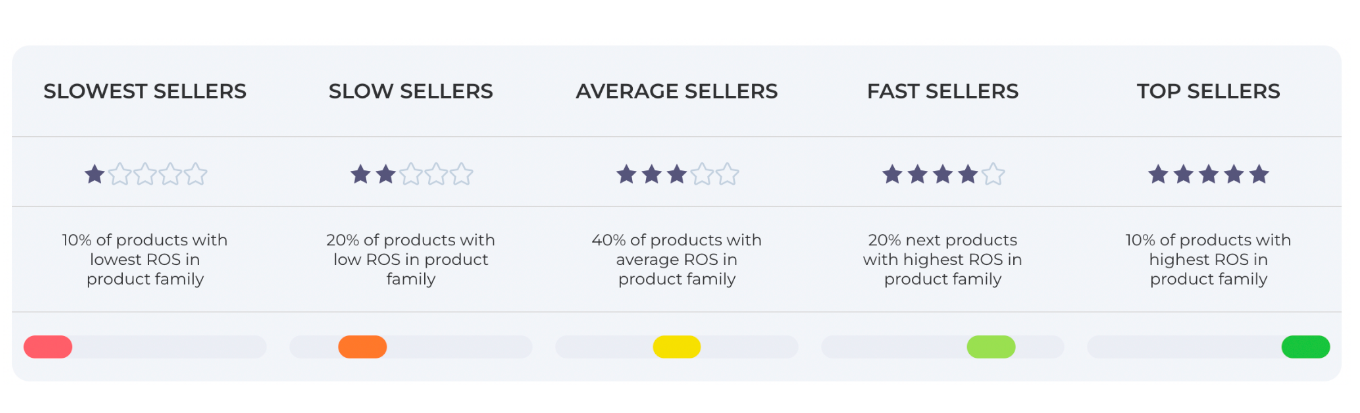
The user will estimate how the product will perform in their stores by a star rating system. Then, Nextail will use an average of the ROS of the product group selected inside the family to calculate the one for the new product.
You have to introduce the information for the new product in order to calculate the forecast
Dates: Here you will select the period of time in which the new product will be sold.Grid size: The size set you will buy for the new product.
Store Clusters: Group of stores in which the new product will be sold. Here you can also select a different period of time in which the product will be sold for each cluster.
Growth: % of variation in sales that will vary in relation to the past year. It can be a negative or positive value.
Sell Through: % of the product quantity that you will have sold at the end of the selling perimeter. It is the same as in the detailed forecast, but this time you will select it before having the final recommended quantity.
And we will again obtain our two main global values: