In this article we explain how these two very important indicators are calculated and applied.
Sell-out
This global indicator allows you to view the performance of unit sales that were purchased and introduced in warehouse. The indicator is available to non-store users.
- The calculation is: units sold / by units purchased.
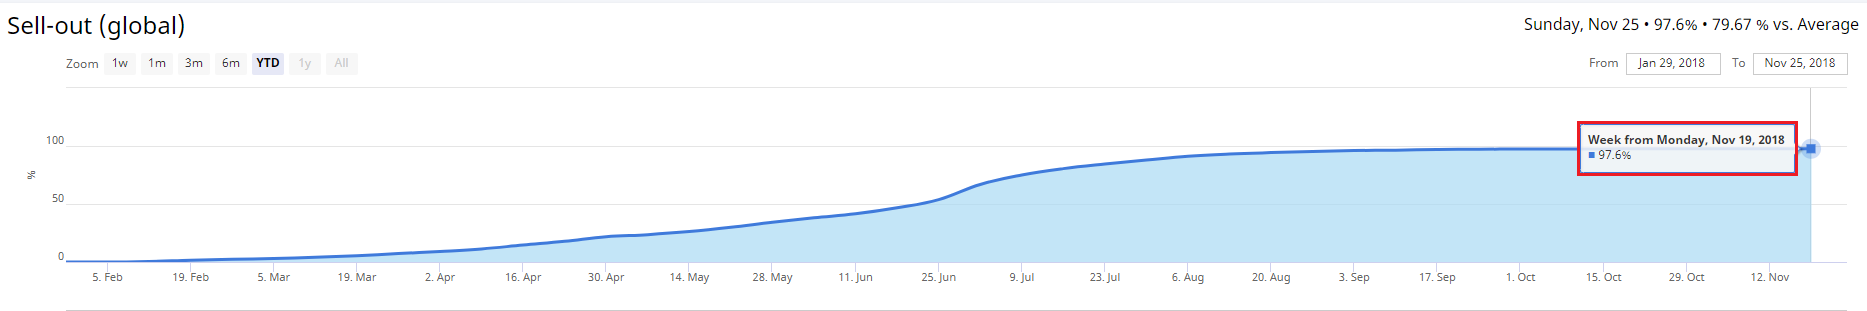
In this chart, you can see the introduction of a new collection. The more units sold, the higher the percentage of sell-out.
- You can use the filters available in these reports to study a product category over a period of time. The available reports are:
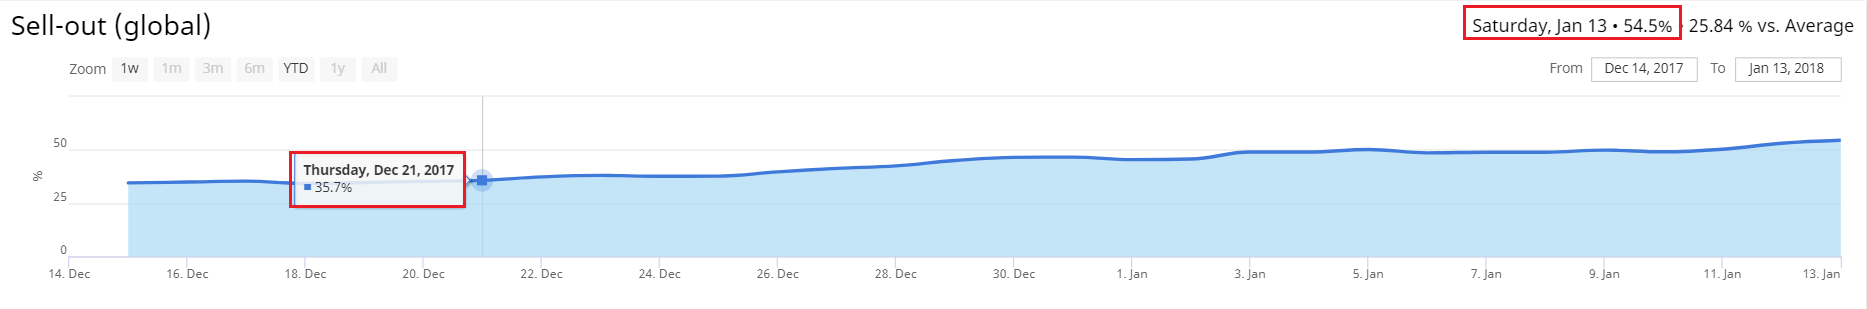
"KPI reports" which allows you to see a graph of day to day sales evolution:
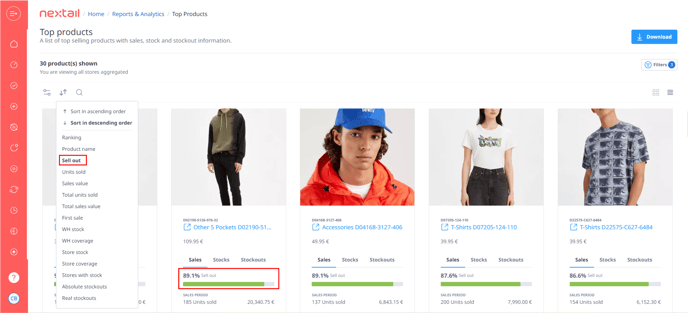
The "Top Products" report lets you sort products by sell-out, using the "Top" or "Bottom" option.

- There are several categories of products that can be viewed: the season, collection, family, specific product, or even a group of products that has recently been replenished in stores. You can also carry out a more thorough cross-analysis with a group of stores, by city, or by region.
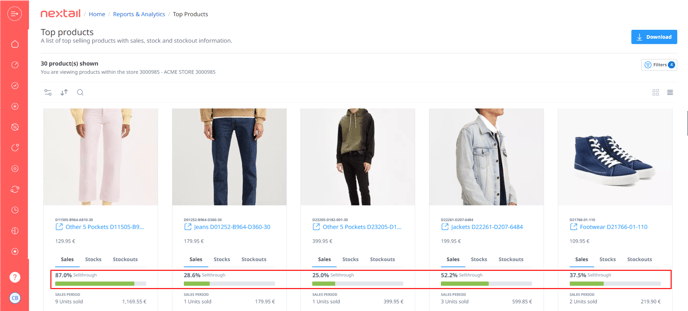
Sell-through
This store indicator is used to measure the evolution of successful sales per product or at product category level.
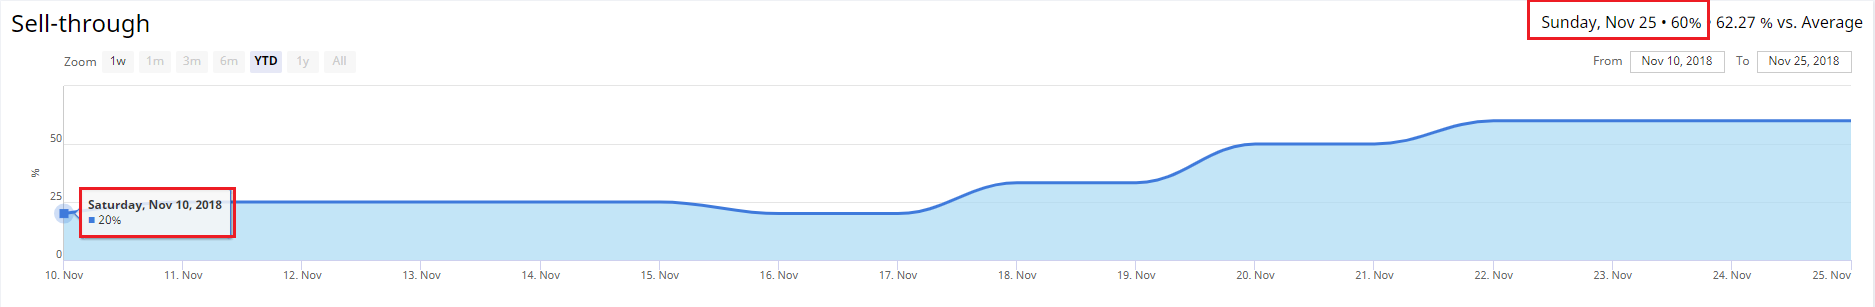
- The calculation is: units sold / units received. In the chart below, you can see that so far, product "x" has had a 60% success rate in terms of sales.
- You can use the available filters to further analyze a specific period of time or product category.
"KPI reports", allow you to see a graphed day-to-day sales evolution. "Top Products" lets you select a store within the filters to view its sell-through percentage.