Theoretically, the replenishment algorithm can be divided in two phases: forecast and optimization
In this article, we are going to study the first phase (forecast) with the aim of understanding how this module processes the information before explaining the second phase, where the allocation of stock to the different stores is optimized.
Forecast
The objective of this phase is to generate a probabilistic forecast at the SKU and store level. In this step, the engine collects existing data (past sales, stockouts, period on display) to predict future sales.
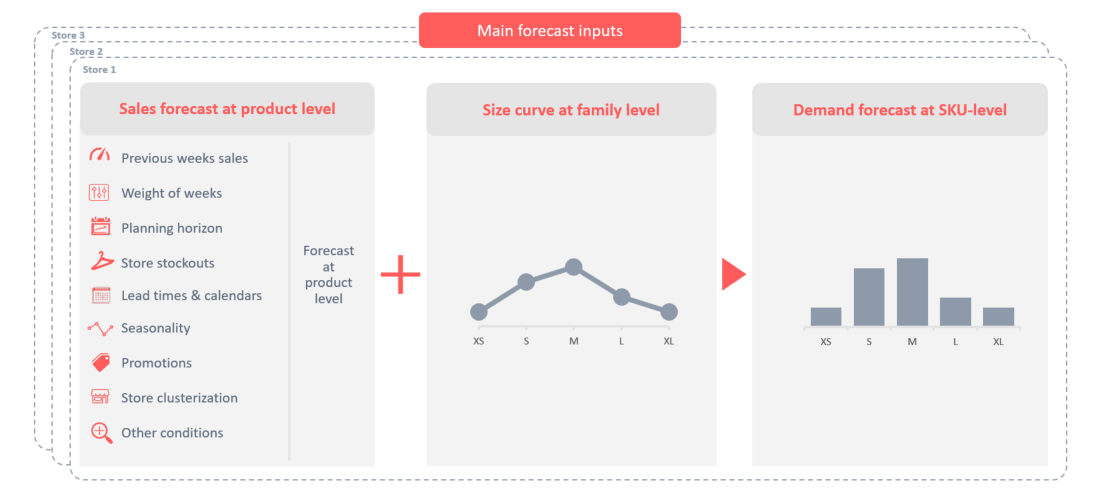
Size curve calculation
- Size curves are calculated once a week based on the last 60 days of sales and at different levels depending on sales quantity.
- To ensure size curves robustness, the minimum number of sales required to calculate at subfamily-size at-specific store level is 40 units.
- The product level is defined by the customer and could be different for each department.
How the size curve is calculated
Previous week sales and stockouts
- The weight of sales is the average in the past weeks. For example: 3 weeks with 20%, 30% and 50% weight each.
- The past stockouts help us understand the product's real demand. The algorithm calculates the stockout rate in the past weeks and uses to forecast the demand for the product in the store.
- It takes into account the stock position for each sku in each store.
Promotions
Promotions can be configured in the system to capture the effect (sales increase) of non-recurring demand events, which can be measured once the promotion has finished.
Seasonality
A key input in calculation demand forecast is the seasonality (short-term trend), which is automatically calculated by Nextail.
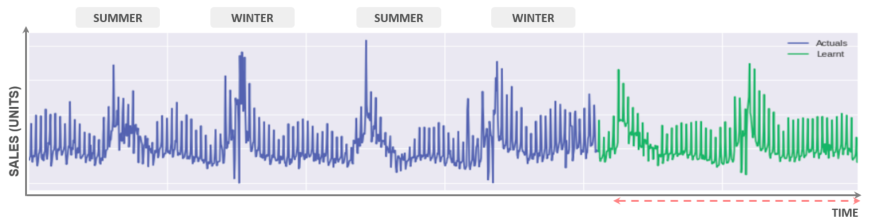
Looking at the graph:
- First, seasonality is automatically calculated based on actual sales (blue line).
- Then, seasonality is calculated for the near future based on historical data (green line).
In creating the forecast there are many factors that need special attention:
- Temporary stock-outs or lack of sales data: when there are missing stock-out data, the solution is to fill in the blanks by using the remaining days and assigning them the weight according to the seasonality.
- Product reintroduced in the warehouse after a long period of being out of stock: when there are not enough past data to prepare a proper forecast, the solution is to delve deeper into the historic data to the time the product was available in the store and there are relevant data.
Store clusters
Nextail creates store clusters for use when data available at store level are scarce. For example, during new store launches, stockout levels are high or a product has recently been introduced.
The creation of the cluster follow the next steps:
- Average sales per product of each store in the past 4 months.
- Weighted by weeks, the recent weeks being more representative.
- Sufficiently representative store groups.
- Based on variability (products selling much higher than average), stores can be moved to the next cluster.
Lead time, calendar and planning horizon
Replenishment takes into account calendar plans and store lead times to project store stock levels by the time the new stocks reach the store.
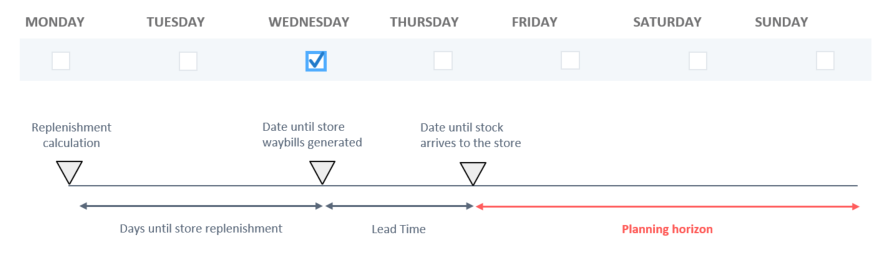
- Nextail calculates the stock consumption between the replenishment calculation day and the day the stock will arrive at the store.
- Product replenishment to cover demand expected in the planning horizon.