This helps you compare the available stock by seasons and period in different years. To see this information:
- Duplicate the Nextail browser tab to view both years at the same time.
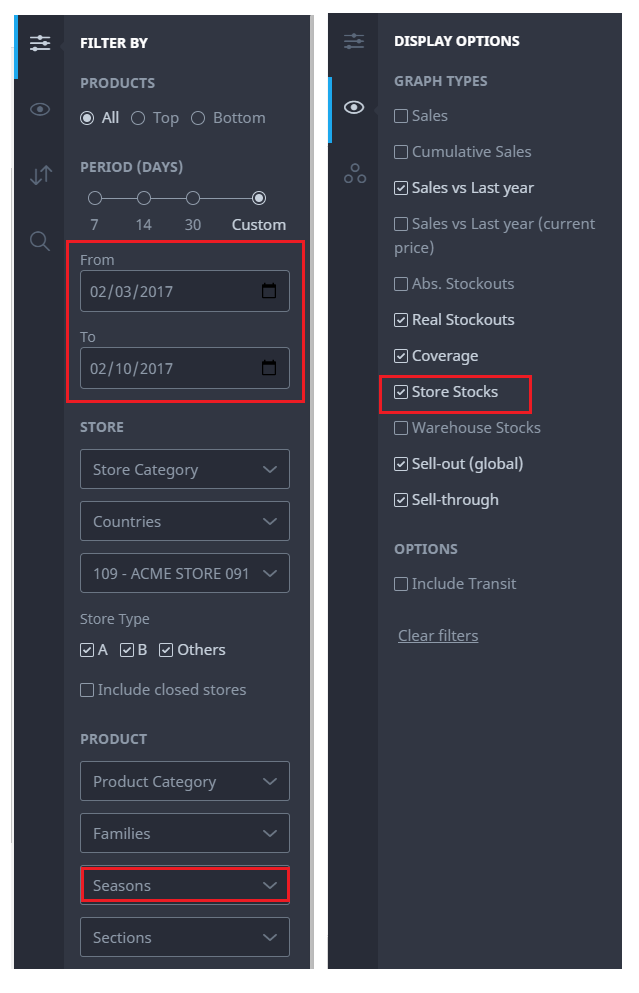
- Click on the filters button and in the "Filter By" layer, select the period of days and product category, i.e. "Season" (optional)
- Switch on "Display options" to select the graph you want to see. i.e. “Store Stocks”
After loading the data, the current or last-year data of store stocks are available for comparison.
