You can use the “Visual rules” tool within “Master Data” to check the current configuration for FA and Replenishment of min. % of sizes in stock, min units per product and min units over sizes per store and product category combinations.

You can download the information, depending on the tab you are First Allocation or Replenishment, by using the button on the top right of the page and edit manually in the file.
Take into consideration that any change in these values will impact on the calculation of these two rules:
- Sizes: Min % of sizes in stock sets the minimum percentage of the size curve to be displayed on the shop floor. If we set 0% we assume that this rule does not exist.
- Units: The minimum number of units is calculated as the maximum value between the min. Units per product and the number of sizes plus the minimum units over sizes. Let’s see it with an example:

This product has 4 sizes, 4 min. units per product and 2 minimum units over sizes. The calculation will be Max(4, 4 + 2) = Max(4,6)= 6.
If we put a high negative value as over size, for instance, -100, we are forced to use the min. units per product.
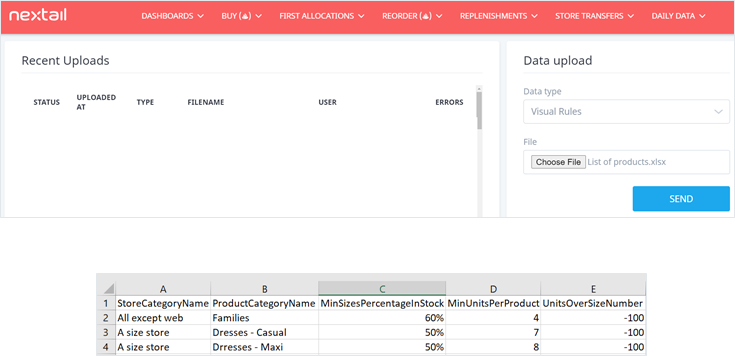
In Daily Data > Data upload, select “Visual rules” ( for Replenishment or Store transfers) or "Visual rules FA” and choose the file to update the values.

The column names for Replenishment: StoreCategoryName, ProductCategoryName, MinSizesPercentageInStock, MinUnitsPerProduct, UnitsOverSizeNumber.
And for First Allocation: StoreCategoryName, ProductCategoryName, MinSizesPercentageInStockFa, MinUnitsPerProductFa, UnitsOverSizeNumberFa.
This option allows you to adjust the conditions for a product to be displayed at a potential store.
.png?height=120&name=Nextail-logo-rojo%20(5).png)