The demand forecast is calculated by product-store and then spread across the size curve according to family-store performance.
It is based on a pre-decided number of weeks in order to cover demand for the entire planning horizon.
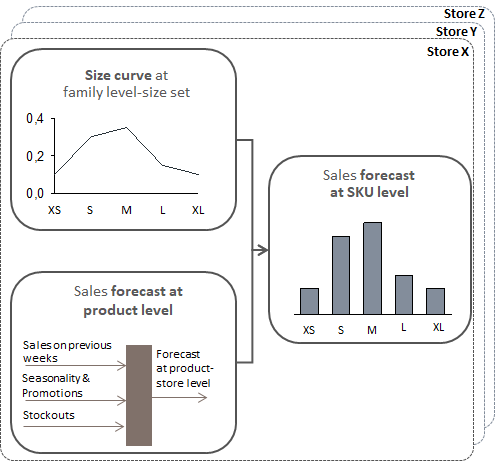
The idea is that the forecast does not simply build on the past sales of the product in question but also on the lost sales resulting from in-store stockouts. It may be that a store is left with only 2 non-consecutive sizes which can lead to the product not being sold at all. If the store had not been out of stock, it could have sold more; hence the higher demand forecast.
In this regard, it may be the case that the algorithm does not have enough data to provide a confident forecast with the forecast weeks included in the scenario: therefore, the forecast weeks can be increased up to maximum of 20 if necessary. The forecast period therefore differs from the period of the sales shown as 7 days and 28 days and so it might not be in line.
In this respect, the forecast weeks selected for the scenario can be higher than 28 days; therefore, the historical data considered for forecast calculation are longer than 4 weeks and therefore could not be in line.