Summary
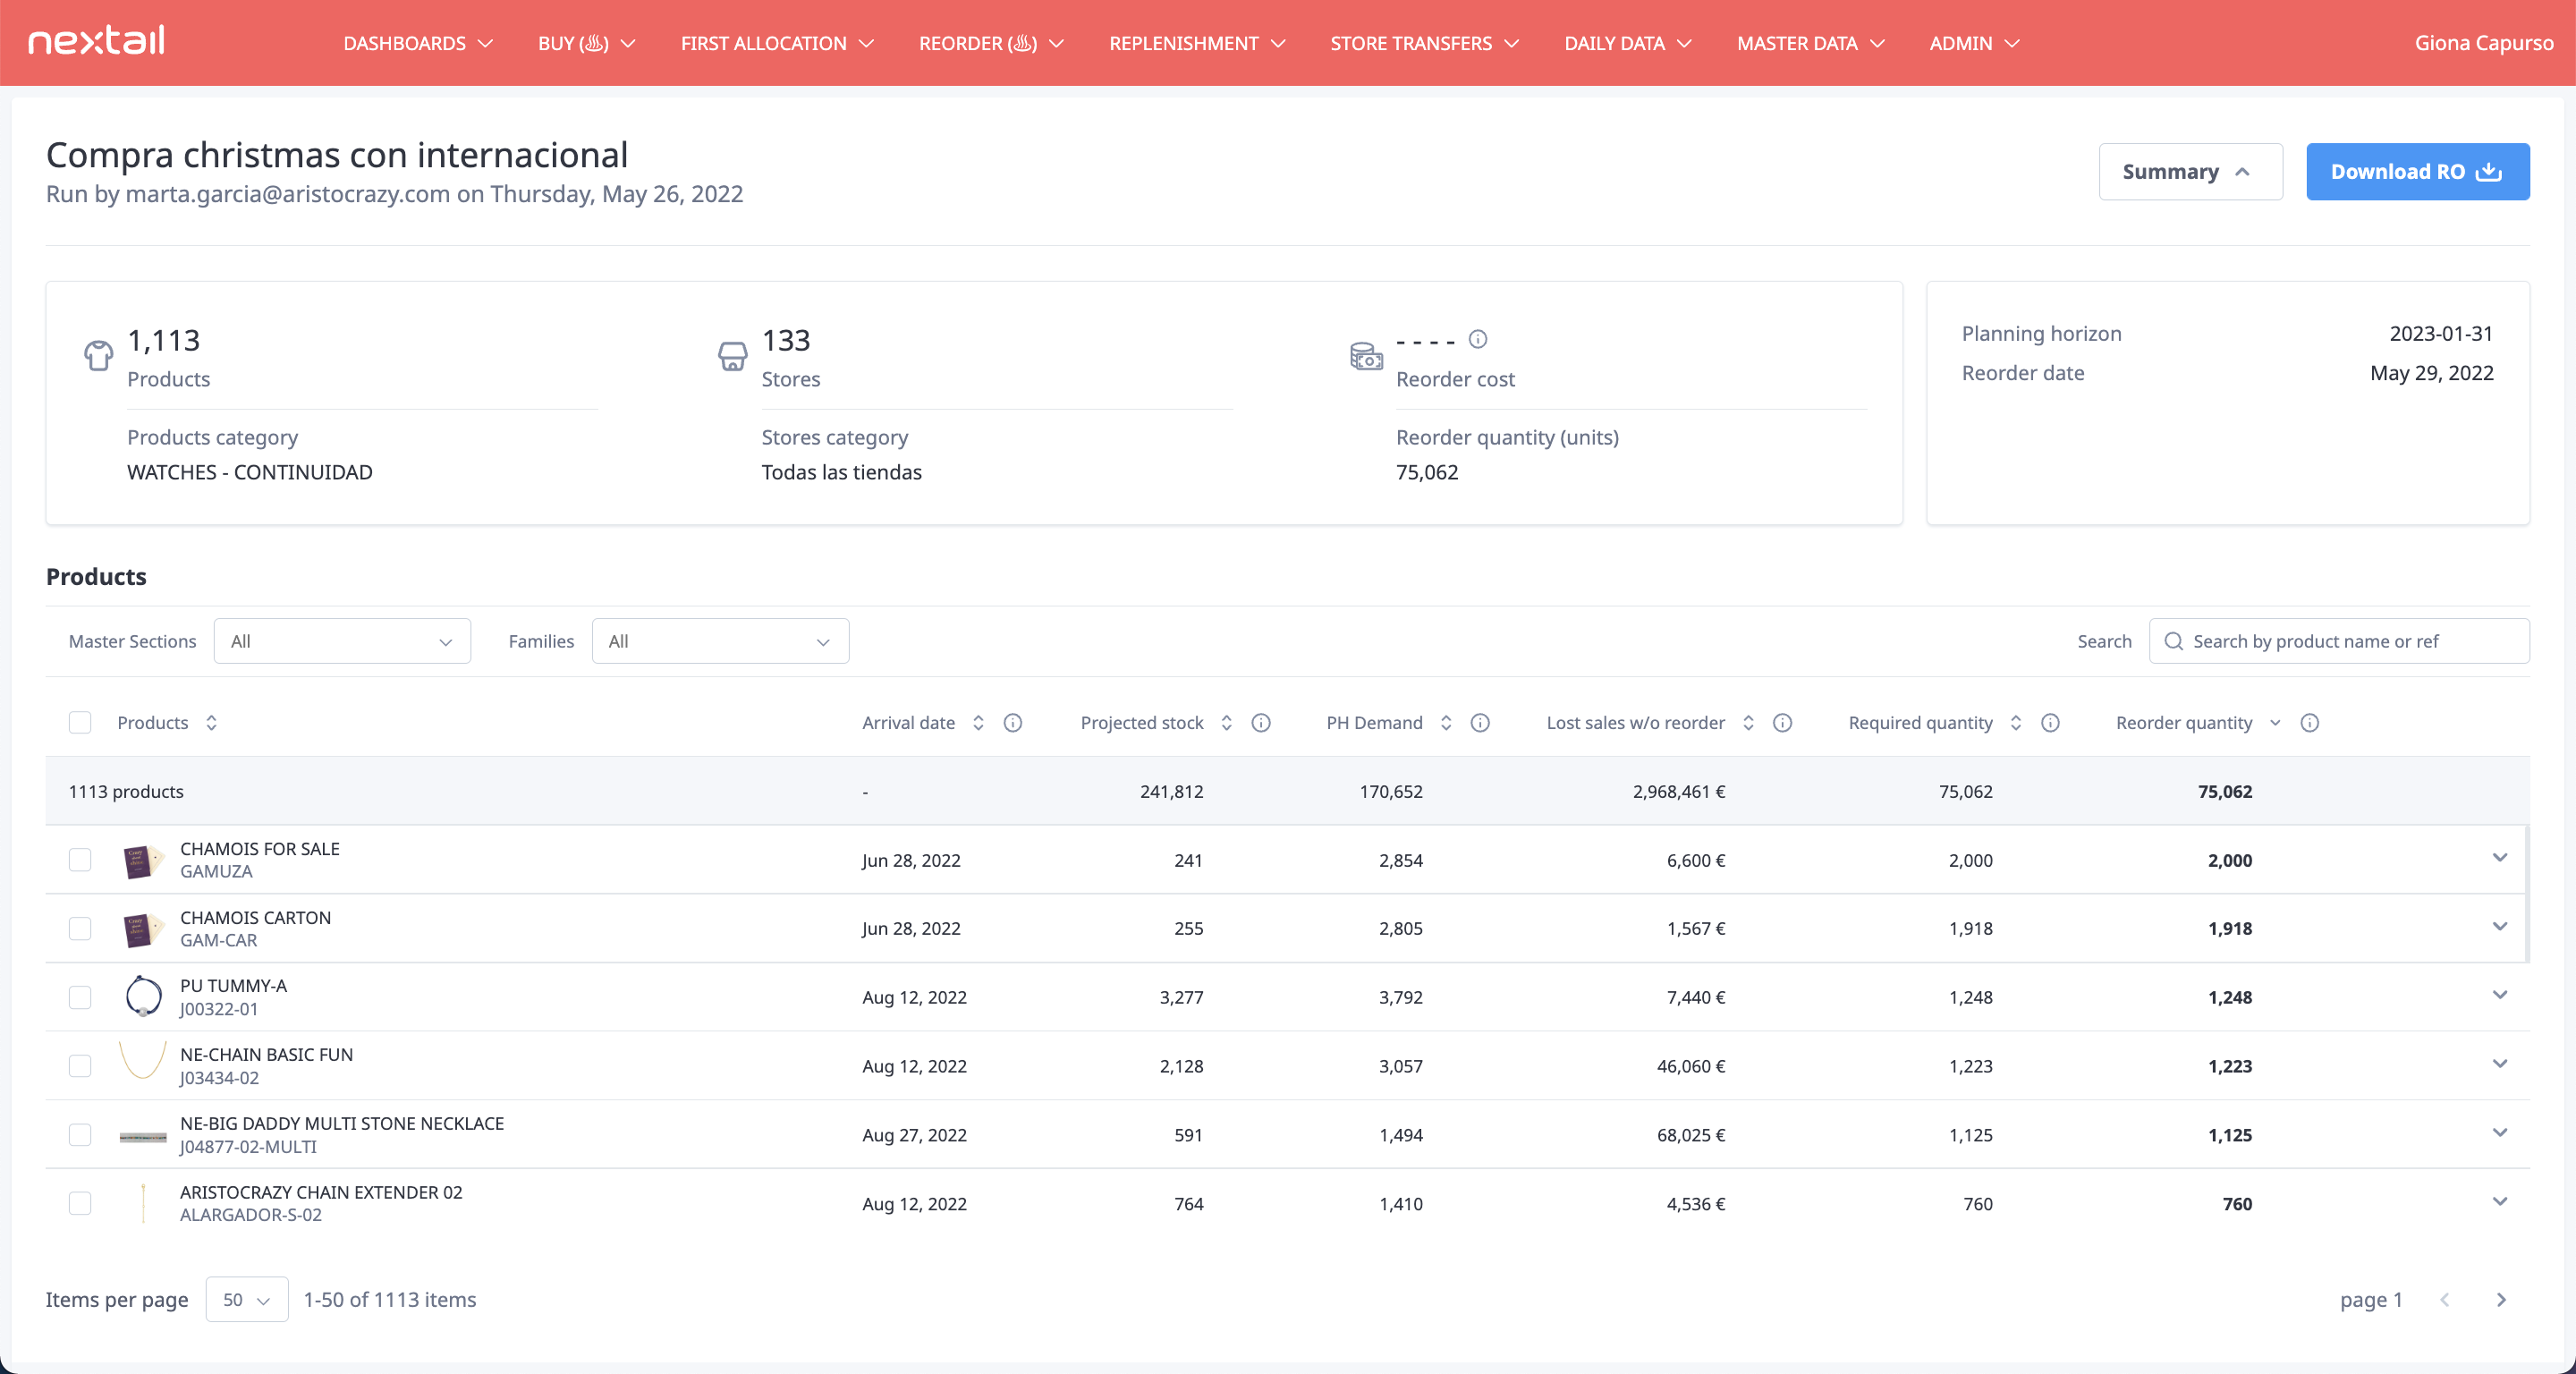
This section of the page is an excerpt of the configuration data that the client has used to run the scenario.
Divided in different sections, we show the group of products and stores, displaying the total number considered in the scenario. Also, the total single units considered and the possible amount of money that will be spent if executed. To display the amount of money the price of the product should be available.
In a separate block appear the rest of the parameters used to calculate the scenario, as a reference. The date when the reorder will take place, the planning horizon and the links to the files used in the scenario to identify changes in the layout or new opening or closures in the store network, only if they are used, of course.
In the top right part, there are a couple of buttons, one to hide/show the summary information and one, the most important probably, to download an Excel file with the results of the scenario.
Product List
This section of the page is an excerpt of the configuration data that the client has used to run the scenario.
Divided in different sections, we show the group of products and stores, displaying the total number considered in the scenario. Also, the total single units considered and the possible amount of money that will be spent if executed. To display the amount of money the price of the product should be available.
In a separate block appear the rest of the parameters used to calculate the scenario, as a reference. The date when the reorder will take place, the planning horizon and the links to the files used in the scenario to identify changes in the layout or new opening or closures in the store network, only if they are used, of course.
In the top right part, there are a couple of buttons, one to hide/show the summary information and one, the most important probably, to download an Excel file with the results of the scenario.
DATA
Every product will show the following information:
- Product: an image, if available, its name and reference,
- Arrival date: the estimated date when the product will arrive to the warehouse,
- Projected stock: the estimated stock of the product when the product arrives to the warehouse. Includes stores stock, pending orders arrived before the arrival date, and warehouse stock (currently all warehouses, without any filter).
- PH demand: the estimated demand of the product during the planning horizon,
- Lost sales without reorder: an estimation of the lost sales for the product during the selected planning horizon if the reorder is not executed,
- Required quantity: total units needed to satisfy the demand and stock until the end of the coverage period,
- Reorder quantity: total units considering production constraints and user modifications
- Total actual stock: total units between all stores in the scenario and all warehouses of the customer. At this moment, warehouses are not filtered.
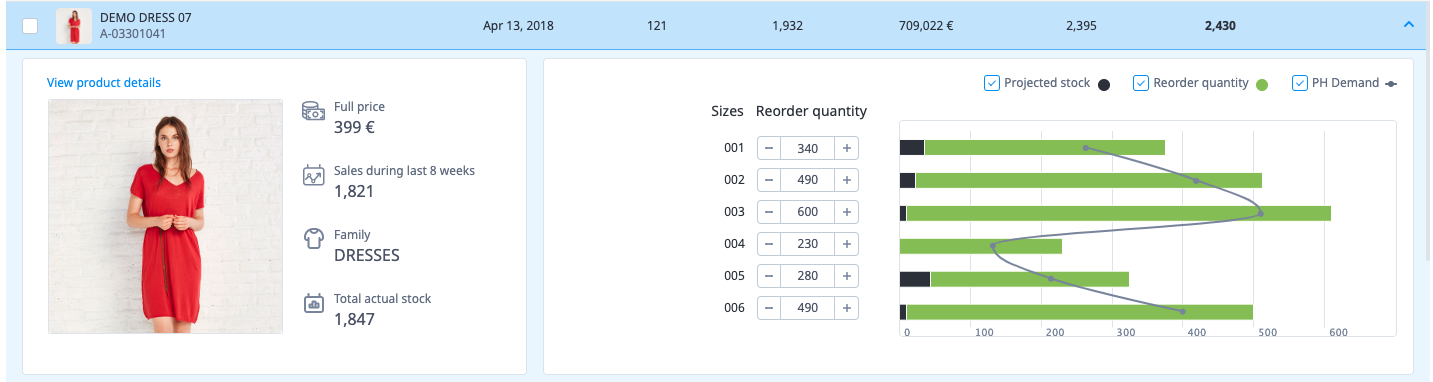
Each row is clickable and will unfold a new section with detailed information about the selected product:
- Product image
- Full price
- Sales during last X weeks: the number of weeks used is a configurable parameter and usually is 8 weeks.
- Total actual stock
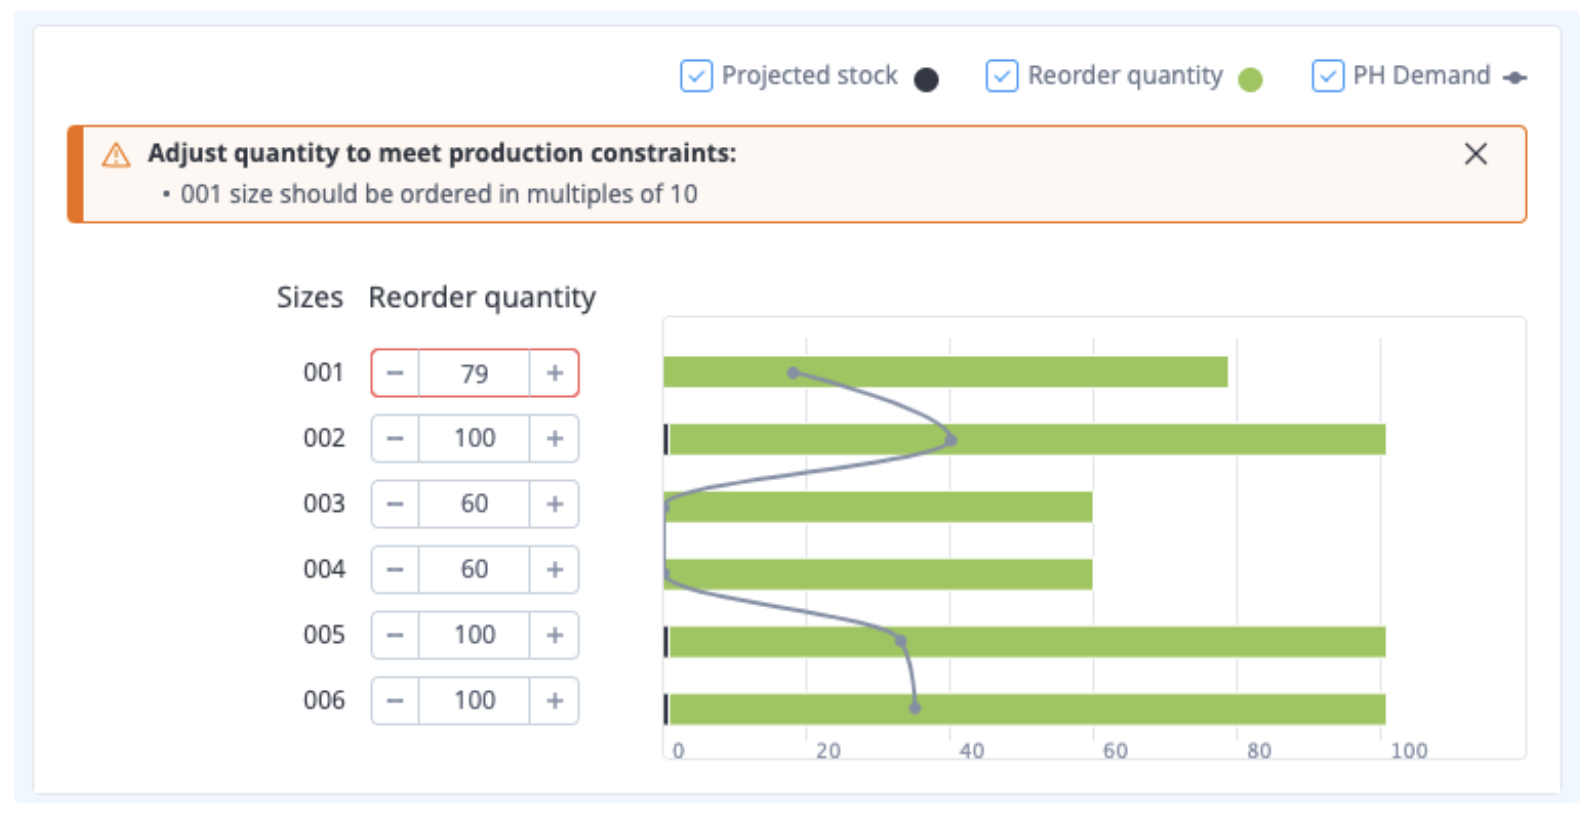
There is a section that shows the SKU detail and allows the user to modify the recommended quantity for each SKU of the product. This section provides a chart with:
- Projected stock
- Reorder quantity
- Planning horizon demand
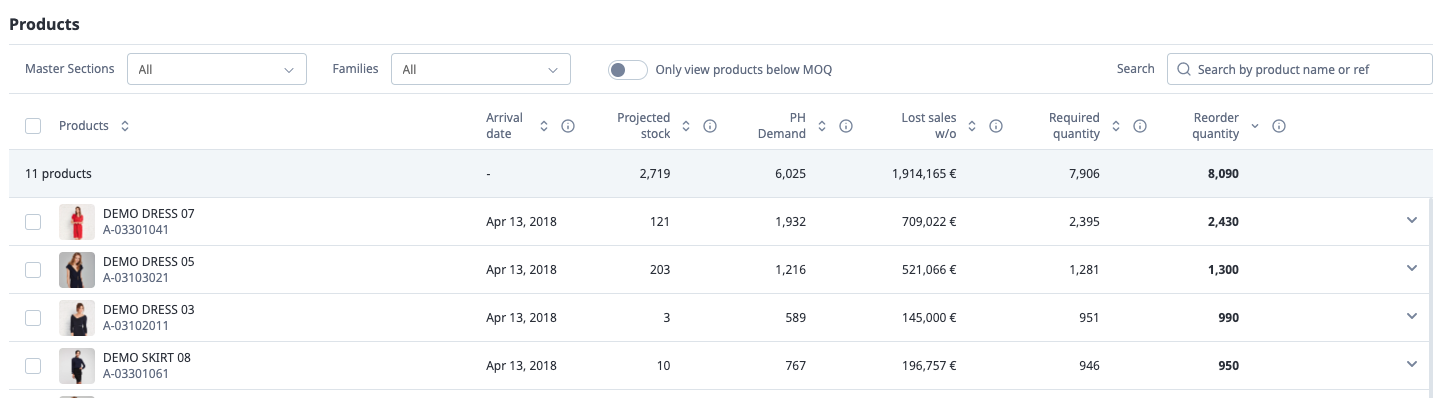
Filters
To ease the analysis of the scenario there are some filters that will allow our users to narrow the number of products in the list. The main filters are Master Sections and Family. There is also a search box to look for products by its name or reference. On top of those filters, users could sort the results using any column as order criteria.
Also, if the customer has provided information about the Minimum Order Quantity (MOQ), another filter will be available to allow users to display only the products affected by this constraint.
Edit SKU quantities
When the user unfolds the product details, the chart that displays the information about each SKU allows the user to modify the total number of units.
If the customer has Box constraints, a warning will appear to warn the user about this fact.
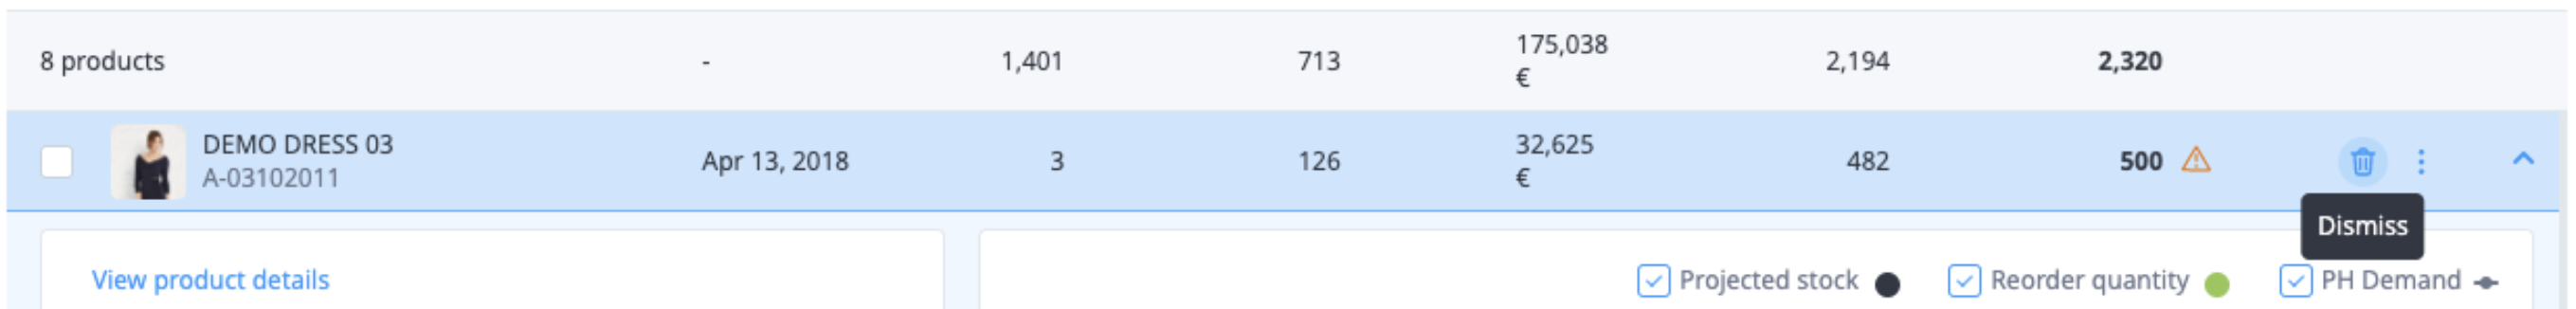
Dismiss product
Hovering over each product row will display a trash icon on the right side of the list. If the user clicks on this icon the total units will be set to 0.
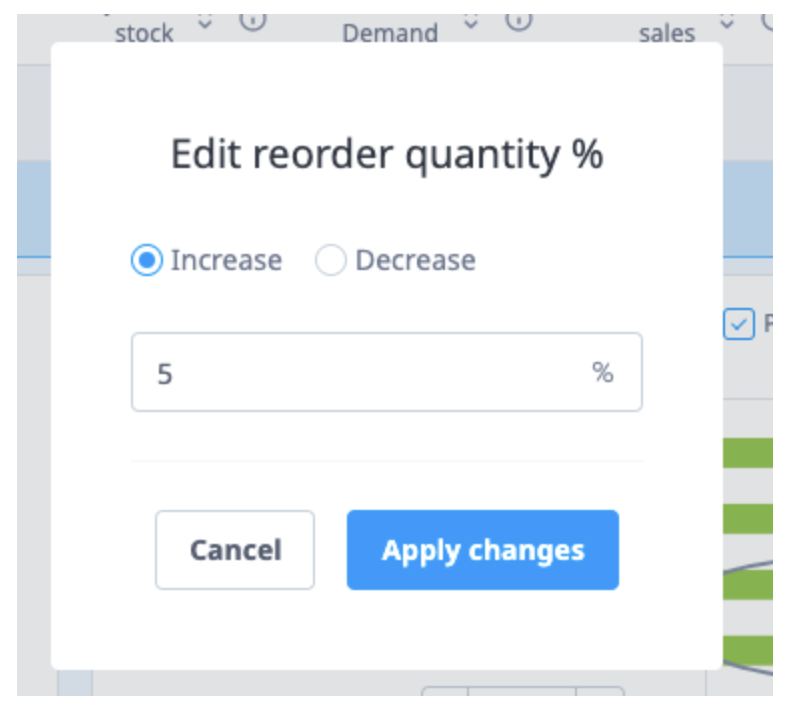
Edit reorder quantity %
Hovering over each product row will display a three dots icon (menu) with an option to apply a percentage over the total of units to reorder. If the user clicks on this icon, a modal window will appear allowing the user to introduce a percentage and apply it to increase or decrease the total amount of units to reorder.
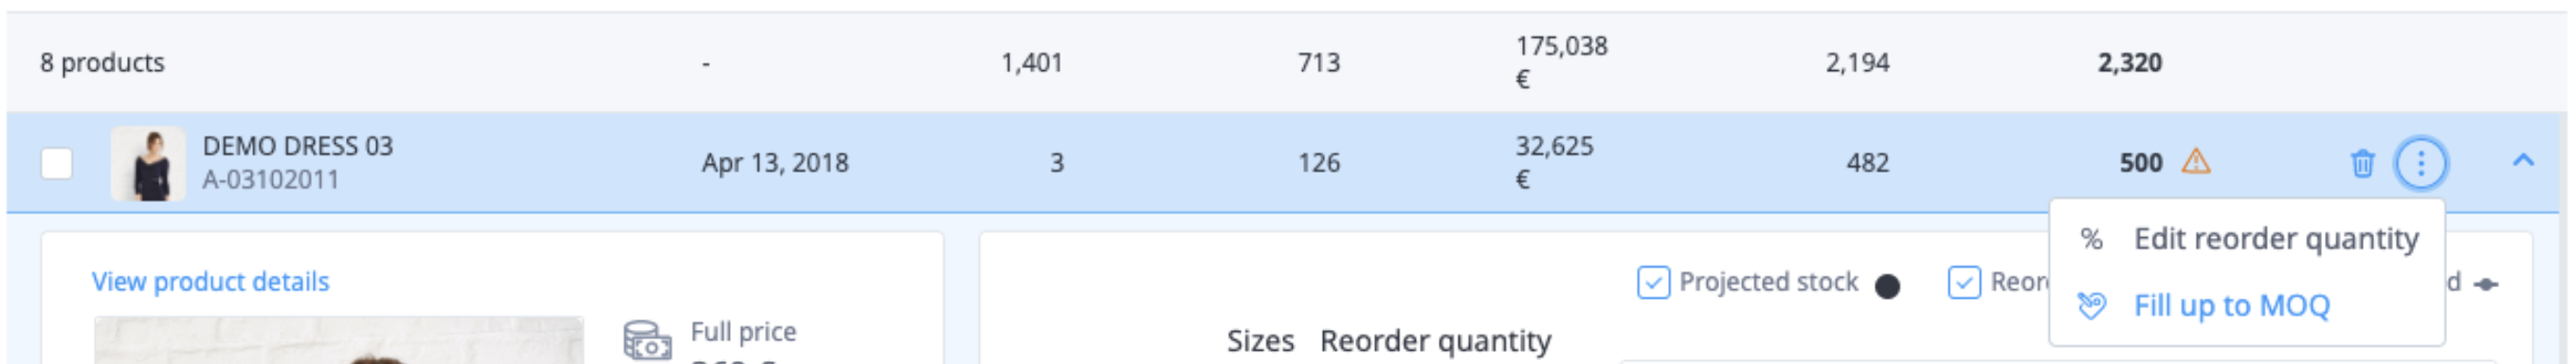
Fill up to MOQ
Hovering over each product row will display a three dots icon (menu) with an option to fill up units to meet the MOQ constraint. This option will only be enabled if the product does not match the required Minimum Order Quantity for the product. If the user clicks on this icon, the total amount of units for the product will be modified to match the MOQ quantity using the weight of each size to distribute the units.
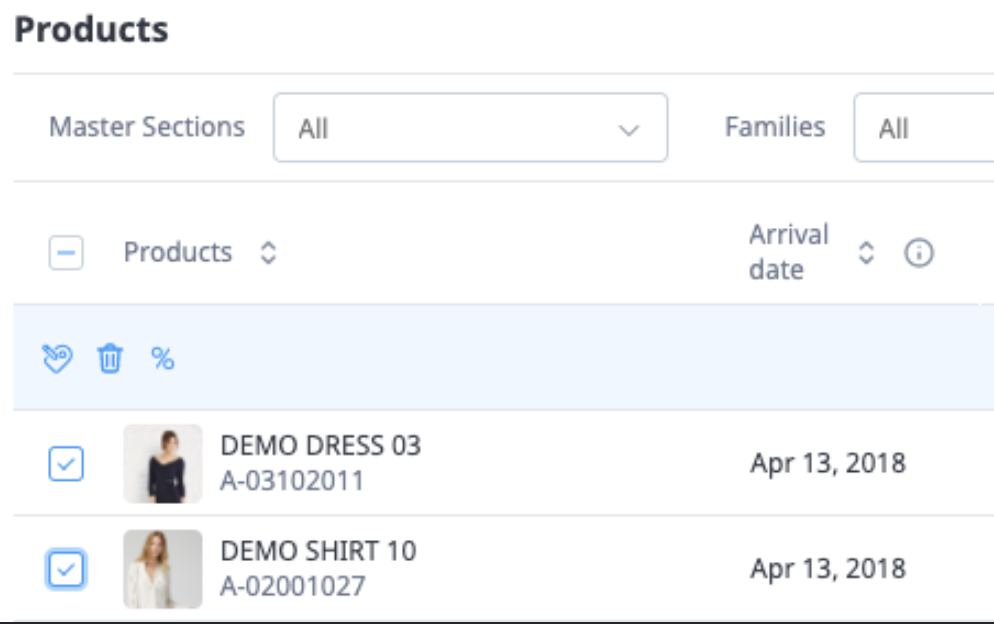
Batch actions
Close to each product there is a checkbox that allows selecting some products and applying the same action to them. After selecting at least one product, new icons will be displayed in the first row of the table.
The available batch actions are: dismiss selected products, edit quantities by percentage and fill up to MOQ. The last one will only appear if MOQ was set for products.