To enhance the understanding of system decisions and improve inventory management, Nextail provides multiple layers of visibility into replenishment scenarios. Each layer allows users to analyze data and parameters at varying levels of granularity, offering a complete picture of the replenishment process. Let’s review them !
Layers of Visibility
Accessing the New Screens
To review the overall results of a past scenario:
- Go to Replenishment > View Past Scenarios.
- Click on the scenario you want to analyze.
Now, let’s dive into the different Layers of Visibility and explore the insights they offer!
- Scenario Level:
At this level, users can view data for all products across all stores. It provides a high-level overview of the entire replenishment scenario.

- Product Level:
If you then click on a product, you can review the detail of a single product at two different levels:
- SKU-Store Level: Analyze data for a single product across all stores, broken down by SKU.

- Aggregated Forecast: View the forecast for a single product across the network, aggregated at the product level.


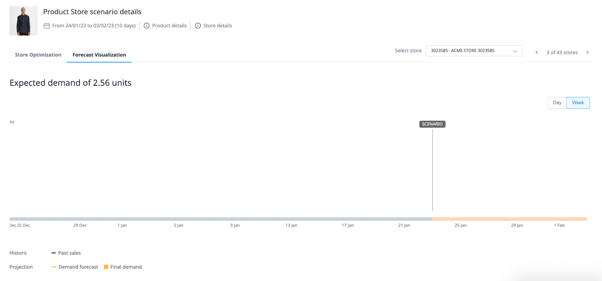
- Product-Store Level:
- Store Parameters: Review store-level parameters such as thresholds and blocks for a single product.

-
- Past and Projected Sales: Understand historical sales and forecasted demand for the product in a specific store.
- Past and Projected Sales: Understand historical sales and forecasted demand for the product in a specific store.
Accessing the Screens
All these views are accessible for seven days after a scenario is launched and can be found through the Summary Page.
Key Features and Data Points
Once a product is selected, users can explore a wealth of data visually broken down at the SKU-store level, including:
- Demand Forecast
- Stock Projection
- Final Stock
- Minimum Displays
- Packs and Prepacks
- SKU Blocks
For instance:
- Products with prepacks display configuration details and replenishment impacts.
- Blocked sizes or missing configurations are highlighted for clarity.

Advanced Analysis
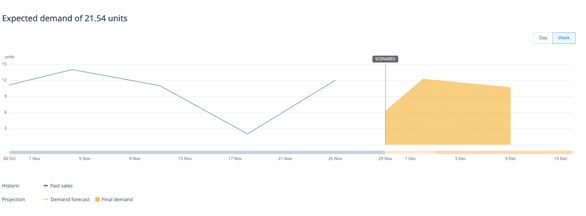
- Forecast Visualization:
- Displays past sales and projected forecasts aggregated by product.
- Accounts for daily and weekly forecast fluctuations, including the impact of upcoming promotions.
- Covers the scenario’s Planning Horizon (up to 30 days) and Lead Time.

- Store Optimization Tab:
Provides a comprehensive view of parameters influencing replenishment decisions, including:- Visual Rules
- Maximum Order Limits
- Thresholds
- Minimum Displays
- Active Promotions

This tab also visually represents factors that:
- Add units (e.g., high demand forecasts).
- Subtract units (e.g., warehouse scarcity).
- Result in the final proposed replenishment quantity.
Making Data-Driven Decisions
These detailed insights enable users to understand how optimization parameters interact to influence replenishment outcomes. By analyzing these data points, users can refine their strategies, ensuring stock distribution aligns with business objectives while addressing store-specific needs.
